US consumers love to buy things again, and the economy can’t keep up with our demands. When demands exceed supplies of the things we buy, we pay more for what is available. Over the last year, prices have risen 7.5% (CPI) because of the supply shortfall. Ouch!
CPI-Consumer Price Index
We’re driving more than we were one year ago. But the oil supply cuts OPEC made for covid combined with the US production cuts over the last year means oil supplies can’t fill the demand in the economy, so we pay more for oil. It’s kinda like an auction on a massive scale, with each buy we make a bid for all the things that go into that product. Or, when driving, you bid for oil by the gallon.
While we’re on energy, I should note that gasoline is up 40.0% over 12 months. Natural gas is up 23.9% from 2021-in the dead of Winter cold. And natural gas is now the power plant’s fuel of choice for making electricity and, low and behold, electricity prices are up 10.7% year over year.
PPI-Producer Price Index
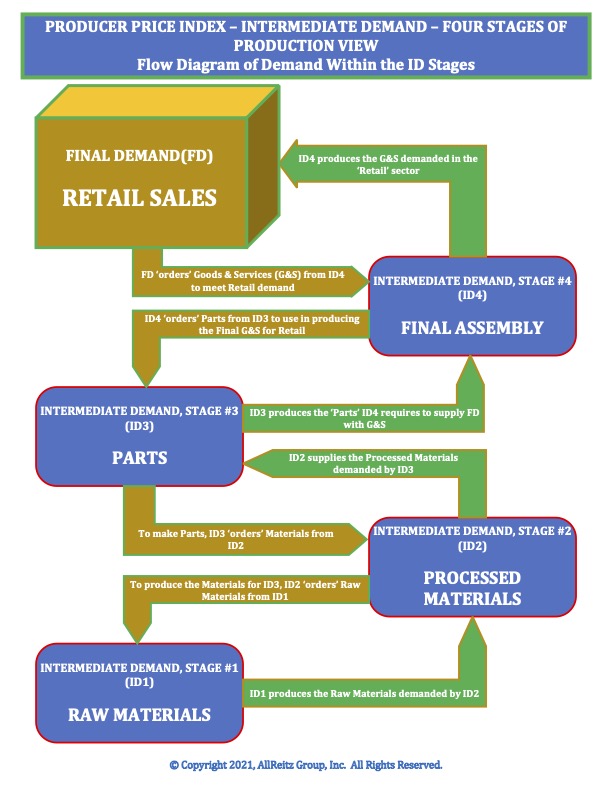
Energy is critical to each stage of production the economy has. Energy is produced in Stage #1, along with other natural resources needed to make the things we buy. The pricing in Stage #1 was up 16.7% for the 12 months.
In Stage #2 of the production process, intermediate demand for processed materials (versus raw materials) pricing is up 17.9%. For Stage #3 is where output from the first two stages goes into making the parts for final assembly, or Stage #4. Stage #3 pricing is up 19.0% and up 12.2% for Stage #4.
The PPI is a precursor to future CPI movement. We can also see where the bottlenecks in the economy exist. The Stage #3 increase of 19.0% indicates high demand for the parts needed to complete products for final demand, Stage #4. That’s where, over the past year, demand is much greater than supply, so if you want the parts, you pay the higher prices. So, Stage #2 prices going up 17.9% over twelve months reflects the demand Stage #3 has for the processed materials needed to build their parts.
In the PPI, prices are based on what producers are getting in each stage. The CPI, on the other hand, is based on what people are paying for things. That’s more the result of what happens before we buy the product. The PPI tracks exactly that. And being based on prices received, it is a much better indicator of where the demand is strongest in the system.
Prediction
I’m not crazy enough to say there’s a method to the prediction, but I’m going to go with the CPI inflation number over the next six months to start below the rate over the last twelve months. Let’s go with 6.5% annual rate through July.
There’s a lot of over stimulation money in the economy that somehow must be washed out. Until it is, we simply have too many dollars trying to buy too few goods. We love to buy things, but at some price level we will stop.


No comments! Be the first commenter?