
A note from ARGI:
During the last 6 months, our 1st Tuesday Blog developed into a monthly look at the economy. In order to continue that, we’ve moved the blog to the 3rd Tuesday of the month. This allows for the data we look at to be more timely by following the publication schedules for all of the data.
So, today is the first issue of our 3rd Tuesday Blog. We hope you enjoy it every month.
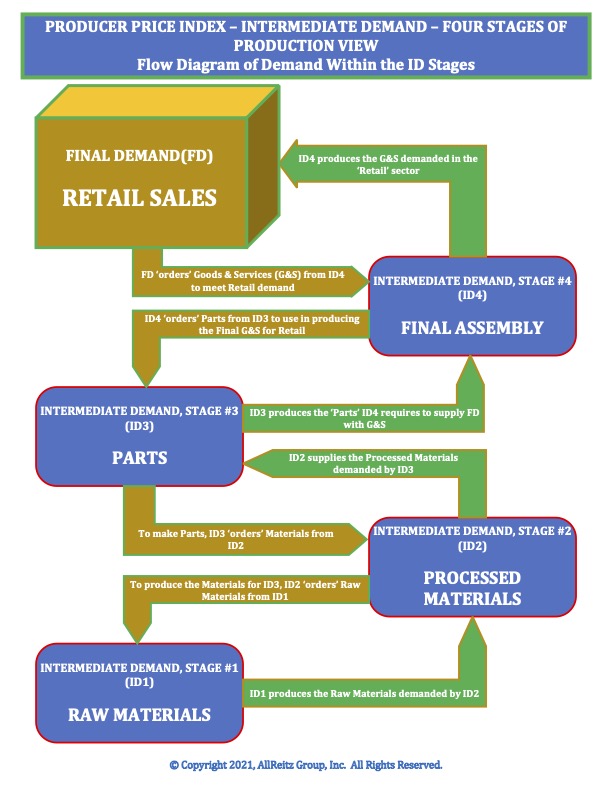
In our economy, demand is the single influencer of what is and is not produced. When we buy Goods & Services (G&S), the economy must produce it! Think of demand, or Final Demand (FD) in the lingo, creating a ‘vacuum’ in the economy that draws resources through Four Stages of production, known as Intermediate Demand (ID), to satisfy the FD. Our ‘buy’ is FD, so let’s track it backwards through those Four Stages.
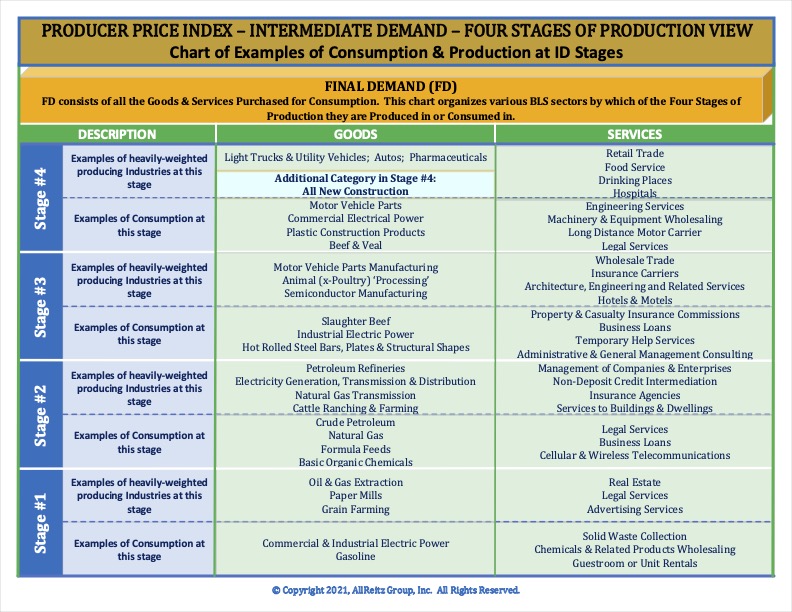
The accompanying flow chart illustrates how our demand, our ‘buy’, creates activity in the ID Stages. FD interacts with ID Stage 4 and then each Stage’s activity creates demand for the Stage below. The accompanying table supplies some examples of G&S relevant to each stage to help understand activities within that stage.
With the country in pandemic lockdown, FD’s ‘normality’ was totally upended. As FD cooled and switched gears, activity in all ID 4 Stages reacted and throttled back normal production, if not cutting it all together. As things open, most of the pre-pandemic FD trends will return, stimulating demand and activity down through the ID 4 Stages. But the time needed is a problem. Production cues must stretch back to Stage 1 to fill the pipeline with the materials and parts necessary to satisfy FD. That process takes time and results in large fluctuations in both price and availability until supply optimizes throughout the 4 ID Stages of production.
Example
Everyone that drives is aware of the spike in gasoline prices recently. As demand for gasoline from consumers and producers crashed with the pandemic, oil producers from OPEC to American Frackers reacted with large production cuts. Over the last year, prices for gasoline stayed low, obviously, because no one could drive anywhere so there was no demand. Several months ago, the restrictions started easing and, sure enough, the demand for gasoline started picking up. With no offsetting supply increase, prices started to climb with demand. The demand (and higher prices) are signaling oil producers that it’s time to raise production to meet that demand. Extracting the oil is in ID 1 in the model. That oil still needs to be processed into gasoline and distributed to your local gas station.
The model of the 4 Stages provides a simplifying view of the economy, allowing us to trace choke points to understand why certain things are happening. In the future, our Third Tuesday Blog will continue commenting on the economy and try to present things in a form readers will find to be “economic understanding, comfortably”. The Flow Chart and Table appearing here will, hopefully, give you insight into your economy’s workings.


No comments! Be the first commenter?